Industry Skills Online Live

Data Analyst & Business Intelligence with Placement Training

This course enables you to walk out not just with knowledge — but with the confidence, skills, and real project experience with Placement Training to land a Data Analyst, MIS Executive, Power BI Developer and Business Intelligence Analyst role. You will be fully prepared to query and analyze data using SQL, build insightful dashboards, design data models, transform raw data into business insights, and deliver results from Day 1 on the job.

5.0 (23 ratings)
56 Total Learners 8-9 Weeks | 1-2 Hours/day Industrial Training Tamil

What You'll Learn

  • Master SQL & Power BI for Professional BI Analysis
  • Build & Publish Enterprise-Level Reports and Dashboards
  • Design Optimized Data Models for Business Reporting
  • Analyze and Transform Data Using SQL for Business Insights
  • Deploy & Manage Reports via Power BI Service
  • Placement Training
  • Go from Job Seeker to Job-Ready BI Analyst

Requirements

  • A laptop/desktop with internet connection
  • Suitable for both IT & Non-IT Professionals

Tools & Technologies

PostgreSQL PostgreSQL
Power BI Power BI
DAX Studio DAX Studio

Course Description

A professionally designed, industry-aligned classroom program built exclusively for job seekers who are serious about becoming a Data Analyst and Business Intelligence Professional

This course goes beyond basic dashboards and reports — it trains you to gather business requirements, analyze complex datasets, translate data into actionable insights, and communicate findings to stakeholders at every level — giving you the confidence to walk into any company and deliver strategic value from your very first day at work.

Right for You?

Who This Course is For

  • Fresh Graduates Looking to Start Their Career as a Data Analyst or BI Analyst
  • Job Seekers Who Want to Go Beyond Basic Reports and Deliver Real Insights
  • Candidates Who Prefer Structured Online Learning with Live Mentor Support
  • Anyone Ready to Commit and Become a Job-Ready Data Analyst or BI Analyst

Course Curriculum

27 modules • 257 lessons
Module 1: Introduction & Setup 2 lessons • 35m
  • Course Introduction 2m
  • Fundamentals, Download, Install, Create Server, Database and Table 33m
Module 2: Data Retrieval & Filtering 4 lessons • 40m
  • Data Retrieval - Select 13m
  • Data Filter - Where 17m
  • Logical Operations 9m
  • Wildcard Filters 11m
Module 3: Data Manipulation 3 lessons • 1h 31m
  • Data Manipulation - Text Functions 39m
  • Data Manipulation - Numerical Functions 22m
  • Data Manipulation - Date Time Functions 30m
Module 4: Aggregation & Joins 3 lessons • 1h 12m
  • Aggregate and Group By Functions 25m
  • Joins - Cartesian/Cross, Inner, Left, Right, Full, Outer, Self 36m
  • CRUD Operations 24m
Module 5: Advanced SQL 5 lessons • 2h 33m
  • Sub Query 16m
  • Nested Query 9m
  • Common Table Expressions 11m
  • Window Functions 38m
  • Regular Expression 78m
Module 6: Introduction to Power BI 5 lessons • 23m 21s
  • What do you learn from this Course? 2m 14s
  • Introduction to Power BI 6m 58s
  • Download Power BI 1m 46s
  • Install Power BI 6m 25s
  • Navigating to User Interface 5m 58s
Module 7: Data Extraction 8 lessons • 34m 03s
  • Manual Data Entry 6m 31s
  • Load Data from Excel File 2m 31s
  • Load Data from CSV File 4m 37s
  • Load Data from XML File 2m 10s
  • Load Data from PDF File 1m 23s
  • Load Data from SQL Database 5m 29s
  • Load Data from Web 2m 20s
  • Load Data from Web API 9m 02s
Module 8: Data Transformation 51 lessons • 2h 58m 25s
  • Power Query Editor 9m 09s
  • Re-use the Data Model 5m 25s
  • Manage Parameters 3m 57s
  • Filtering Rows based on Number Column 5m 53s
  • Filtering Rows based on Text Column 4m 19s
  • Filtering Rows based on Date Column 6m 43s
  • Advanced Filtering Using Logical Operations 6m 58s
  • Manage Queries 7m 55s
  • Manage Columns 2m 21s
  • Keep or Remove Rows 4m 46s
  • Handling duplicate values 3m 16s
  • Remove Blank Rows (Null Values) 19s
  • Handling Error Values 3m 04s
  • Sort Data 2m 25s
  • Split column by Delimiter 6m 31s
  • Split column by Other Features 5m 09s
  • Group Rows by Count 4m 32s
  • Group Rows by Sum 2m 39s
  • Group Rows by Average/Mean 53s
  • Group Rows by Median 50s
  • Group Rows by Min and Max 1m 41s
  • Find duplicates inside Group 2m 24s
  • Change Data Type 3m 23s
  • Manage Headers 1m 12s
  • Replace Values 2m 30s
  • Append Queries 5m 22s
  • Combine Files 3m 03s
  • Merge Queries 7m 17s
  • Merge All Types 10m 15s
  • Transpose Rows and Columns 1m 08s
  • Reverse Rows 44s
  • Count Rows 1m 15s
  • Rename Columns 33s
  • Fill Neighbor Values 1m 10s
  • Re-arranging the Columns 1m 05s
  • Convert to List 1m 12s
  • Text Formatting 3m 23s
  • Text Extraction 4m 24s
  • Statistics 3m 57s
  • Math Operations 4m 39s
  • Date Time Functions 4m 09s
  • Execute R Script 2m 22s
  • Execute Python Script 2m 29s
  • Add Columns From Example 2m 29s
  • Adding Custom Columns 1m 58s
  • Adding Index Column 1m 26s
  • Adding column by Custom Function 5m 01s
  • Duplicating the Column 12s
  • Adding Conditional Column 2m 35s
  • View Operations 3m 32s
  • Query Dependency 4m 31s
Module 9: Data Modeling 6 lessons • 49m 08s
  • Relationships in Data Model 11m 38s
  • Measures and Calculated Column 8m 44s
  • DAX Table 9m 12s
  • Calculation Group 7m 24s
  • Model Security 4m 02s
  • Q&A Setup 8m 08s
Module 10: Data Visualization 19 lessons • 1h 26m 09s
  • Bar and Column Charts 13m 44s
  • Line and Area Charts 7m 24s
  • Line and Stacked/Clustered Column Charts 2m 56s
  • Ribbon Chart 1m 38s
  • Waterfall Chart 3m 29s
  • Funnel Chart 2m 31s
  • Scatter Chart 5m 25s
  • Pie and Donut Chart 6m 17s
  • Treemap 2m 48s
  • Map and Filled Map 4m 38s
  • Gauge Chart 4m 08s
  • KPI Metrics 1m 28s
  • Cards and Slicers 8m 27s
  • Table and Matrix 3m 58s
  • Python Visualization 3m 41s
  • Visualization using R Scripting 2m 02s
  • Key Influencers 3m 04s
  • Decomposition Tree 5m 55s
  • Narrative 2m 36s
Module 11: Dashboard Building & Publishing 1 lesson • u2014
  • Report Building & Publishing Dashboard u2014
Module 12: Introduction to DAX & DAX Studio 3 lessons • 10m 15s
  • Introduction to DAX 3m 35s
  • Introduction to DAX Studio 3m 42s
  • Connect Power BI Data Model 2m 58s
Module 13: DAX Queries Foundation 6 lessons • 44m 7s
  • Evaluate and Select Columns 10m 56s
  • Order By 5m 17s
  • Start At 8m 14s
  • Row 3m 53s
  • Var 8m 25s
  • Define Variable 7m 22s
Module 14: DAX Operators 4 lessons • 48m 6s
  • Arithmetic Operators 12m 45s
  • Comparison Operators 8m 31s
  • Text Concatenation Operator 3m 19s
  • Logical Operator 23m 31s
Module 15: Table Manipulation Functions 19 lessons • 1h 44m
  • Distinct 2m 39s
  • Add Columns 11m 44s
  • Generate Series 2m 7s
  • Data Table 9m 17s
  • Cross Join 4m 22s
  • Generate 8m 8s
  • Generate All 2m 17s
  • Natural Inner Join 3m 27s
  • Natural Outer Join 2m 38s
  • Summarize 4m 44s
  • Rollup 4m 59s
  • Rollup Group 3m 31s
  • Summarize Columns 3m 46s
  • Rollup Is Add SubTotal 4m 7s
  • Add Missing Items 3m 59s
  • Rollup Is SubTotal 5m 46s
  • Summarize 4m 44s
  • Set Operations 14m 9s
  • TopN 7m 53s
Module 16: Aggregate Functions 11 lessons • 32m 23s
  • Count and CountX 4m 45s
  • CountA and CountAX 3m 8s
  • Counting Blank Values 1m 32s
  • Counting Rows 1m 2s
  • Counting Distinct Values 2m 44s
  • Minimum Values 5m 10s
  • Minimum Expression 1m 33s
  • Maximum Values 3m 7s
  • Sum Operations 2m 25s
  • Product Operations 2m 41s
  • Average Operations 4m 16s
Module 17: Logical Functions 10 lessons • 40m 11s
  • AND Operation 3m 12s
  • OR Operation 2m 17s
  • NOT Operation 1m 24s
  • IF Condition 4m 54s
  • True and False 2m 35s
  • If Eager 8m 47s
  • If Error 3m 8s
  • Coalesce 4m 51s
  • Switch with Exact Match 3m 19s
  • Switch with Numerical Comparison 5m 44s
Module 18: Information Functions 17 lessons • 1h 8m
  • Column Statistics 3m 56s
  • Contains 6m 55s
  • Contains Row 1m 41s
  • Contains String 6m
  • Filter and Slicer Simulation (Treat As) 11m 39s
  • Has One Filter 9m 16s
  • Has One Value 1m 28s
  • Is Filtered 4m
  • Is Cross Filtered 4m 6s
  • Text and Non-Text Column 2m 14s
  • Number Odd Even 3m 10s
  • Is Blank 2m 29s
  • Is Error 2m 14s
  • Is Logical 1m 29s
  • Is Empty 1m 11s
  • Is SubTotal 3m 9s
  • Is InScope 3m 50s
Module 19: Math Functions 13 lessons • 22m 6s
  • Division and Modulus 3m 21s
  • Ceiling and Floor 2m 43s
  • Rounding 3m 21s
  • Rounding up and Rounding Down 2m
  • Truncate 1m 13s
  • Rounding to Even 1m 3s
  • Power 1m 28s
  • Square Root 33s
  • Exponential Growth 44s
  • Sign and Absolute Value 1m 13s
  • Factorial 1m 17s
  • GCD and LCM 1m 57s
  • Logarithm 1m 13s
Module 20: Text Functions 13 lessons • 42m 42s
  • Concatenate 8m 29s
  • ConcatenateX 2m 20s
  • Exact 2m 44s
  • Find and Search 3m 48s
  • Fixed 2m 43s
  • Format 6m 37s
  • Value 2m 36s
  • Left, Mid, and Right 3m 12s
  • Length 52s
  • Trim 3m 5s
  • Replace and Substitute 3m 53s
  • Upper and Lower 1m 15s
  • Repeat 1m 8s
Module 21: Date and Time Functions 10 lessons • 25m 56s
  • Date and Time 2m 24s
  • Calendar 2m 25s
  • Calendar Auto 3m 53s
  • Date Difference 3m 3s
  • Date Value 1m 18s
  • Date Extraction 2m 25s
  • Send Notification and Set Due Date 2m 23s
  • Networkdays 4m 16s
  • Current Values 1m 42s
  • Week day 2m 7s
Module 22: Time Intelligence Functions 13 lessons • 52m 3s
  • Date Time Intelligence 6m 7s
  • Closing and Opening Balance of the Month 7m 2s
  • Closing and Opening Balance of the Quarter 2m 31s
  • Closing and Opening Balance of the Year 5m 1s
  • Dates Between 1m 47s
  • Dates in Period 2m 11s
  • Date Add 9m 13s
  • Start and End of Month 3m 37s
  • Start and End of Quarter 2m 39s
  • Start and End of Year 2m 35s
  • First and Last Date 1m 10s
  • Previous and Next 6m 4s
  • Last Year Same Period 2m 6s
Module 23: Parent and Child Functions 4 lessons • 8m 41s
  • Path 2m 21s
  • Path Length 1m 25s
  • Path Item and Reverse 3m 28s
  • Path Contains 1m 27s
Module 24: Relationship Functions 5 lessons • 25m 43s
  • Cross Filter 7m 46s
  • One Way Vs Both 5m 23s
  • Related Column 1m 40s
  • Related Table 4m 36s
  • User Relationship 6m 18s
Module 25: Filter Functions 12 lessons • 1h 8m
  • Calculate 3m 56s
  • Treat As 2m 33s
  • Calculate Table 1m 49s
  • All Voice Update 12m 8s
  • All Cross Filtered 7m 34s
  • All Except 6m 57s
  • All Selected 10m 36s
  • All No Blank Rows 3m 43s
  • Earlier 7m 57s
  • Filter 2m 8s
  • Keep and Remove Filters 7m 15s
  • Lookup Value 1m 57s
Module 26: Window Functions 4 lessons • 36m 10s
  • Index 8m 57s
  • Offset 5m 13s
  • Window 6m 18s
  • Rank 15m 42s
Module 27: Placement Training 6 lessons
  • Resume Building
  • Telephonic Interview Preparation
  • Coding Round Preparation
  • Technical Interview Preparation
  • HR Interview Preparation
  • Job Application Guidance
Our Advantage

Why Choose This Course

  • Built Exclusively for Job Seekers & Working Professionals
  • Suitable for Data Analyst, Power BI Developer, MIS Executive and BI Analyst Jobs
  • Classroom Training with Real Mentor Guidance
  • Placement Guidance Included

Your Instructors

Leelavathi Ramesh

Leelavathi Ramesh

Business Intelligence Analyst

16 Courses

4+ years of experience as a Business Intelligence Analyst, with hands-on expertise at Variablz Technology and Schneider Electric. Statistics graduate with practical experience across Marketing, Production, and Sales Analytics.

Parthiban Kannan

Parthiban Kannan

Co-founder & Manager

24 Courses

14+ years of experience in digital transformation, leading teams of 15+ members and delivering 160+ projects for organizations like Lakshmi Machine Works, Milacron, Schneider Electric, Aatomz Research, and Variablz Technologies. AI innovator with a patent approved by the Government of India, with strong expertise in Data Science, Data Analysis, Business Intelligence, and Software Development.

Course Outcomes

What Our Students Build

Articles, projects, research papers and more — real work by our learners applied beyond the classroom.

FAQ

Frequently Asked Questions

Who is this course designed for?

This course is designed for anyone looking to start or transition into a Data Analyst or BI Analyst role. whether you come from an IT or non-IT background, are a fresh graduate, or a working professional looking to upskill.

Do I need prior experience in SQL or Power BI to join this course?

No prior experience is required. The course starts from the fundamentals and gradually progresses to advanced concepts, making it suitable for absolute beginners.

What software do I need to get started?

You will need Power BI Desktop and PostgreSQL, both of which are free to download. A laptop or desktop with a stable internet connection is sufficient.

Will I get hands-on practice during the course?

Yes. The course includes coding sessions, mentored projects, and a capstone project to ensure you gain real, practical experience u2014 not just theoretical knowledge.

Is this course suitable for non-IT professionals?

Absolutely. The course is structured to be accessible for both IT and non-IT professionals. No programming background is needed to get started.

What kind of projects will I work on?

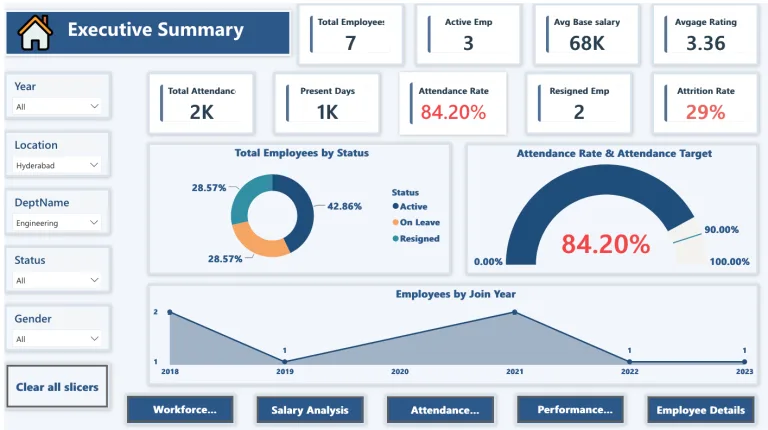
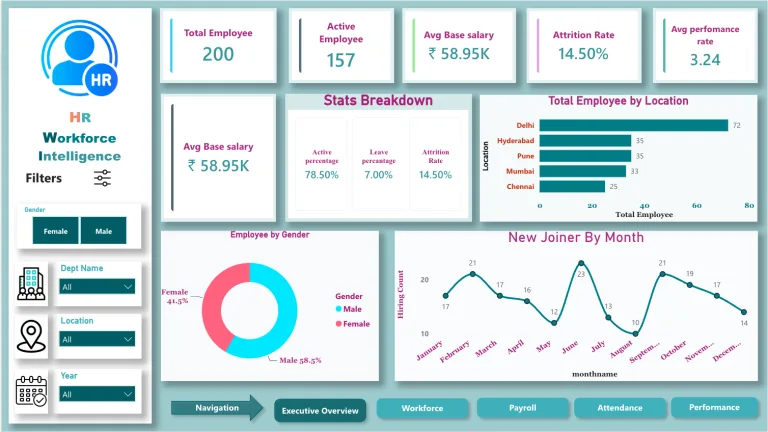
You will build real-world dashboards across domains like Sales, HR, Finance, and Operations u2014 giving you a portfolio of work you can present directly to employers.

Will I learn SQL as part of this course?

Yes. SQL is covered in depth u2014 from data retrieval and filtering to advanced topics like window functions, CTEs, and subqueries u2014 all taught in the context of business analysis.

What roles can I apply for after completing this course?

You will be prepared for roles such as BI Analyst, Data Analyst, Reporting Analyst, MIS Analyst, and Business Analyst with a data focus u2014 across industries.