

Industry Skills Online Live

Python Data Analyst – Bootcamp

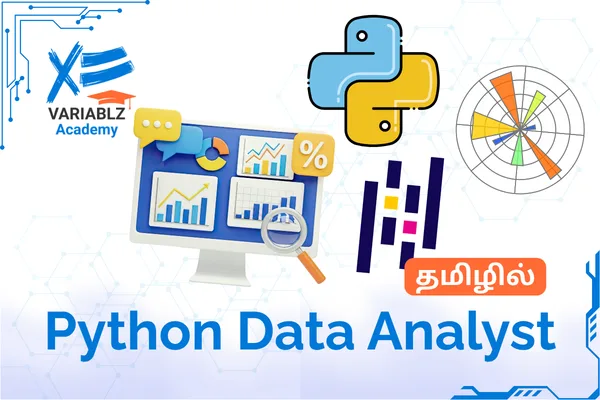
By the end of this course, you'll be able to clean, transform and analyze real-world messy data using Python and Pandas — just like a working Data Analyst does. You'll create charts and visual reports using Matplotlib and Seaborn to turn raw numbers into clear, easy-to-understand insights. Most importantly, you'll walk away with a completed Capstone Project and the clarity to confidently decide if Data Analytics is the right career move for you.

4.9 (27 ratings)
47 enrolled 4 to 5 Weeks Industry Skills Tamil

What You'll Learn

  • Python Programming Fundamentals
  • Data Manipulation with Pandas
  • Real-World Data Cleaning
  • Data Transformation Techniques
  • Exploratory Data Analysis
  • Data Visualization with Charts

Requirements

  • Basic Computer Operating Skills Mandatory

Tools & Technologies

Python Python
Pandas Pandas
Matplotlib Matplotlib

Course Description

Confused whether Data Analyst is the right career switch for you? This 4–5 week live bootcamp gives you a real taste of the job — not just theory. Learn Python, Pandas, NumPy, Matplotlib and Seaborn by working on actual data like an analyst does, day to day. By the end, you’ll know exactly what a Data Analyst does — and whether this path is truly for you.

Right for You?

Who This Course is For

  • Non-IT to IT Switchers
  • Absolute Beginners in Data
  • Career Break Returners
  • Students Exploring Data Careers
  • Working Professionals Seeking Clarity

Course Curriculum

4 modules • 23 lessons
Section 01 - Programming with Python 6 lessons
  • Fundamentals
  • Data Structures
  • Conditional Clauses
  • Loops & Controls
  • Functions & Modules
  • File Handling
Section 02 - Data Mining with Pandas 6 lessons
  • Fundamentals of Pandas
  • Handling Cell, Row & Columns
  • Filter, Sort & Remove Data
  • Aggregate, Group By & Custom Functions
  • Concatenate, Join and Merging DataFrames
  • Descriptive Statistics, Sampling & Missing Values
Section 03 - Data Visualization with Matplotlib 6 lessons
  • Anatomy of Charts
  • Trend Charts
  • Comparison Charts
  • Composition Charts
  • Distribution Charts
  • Relationship Charts
Section 04 - Real World Industrial Project 5 lessons
  • Data Extraction
  • Data Cleaning & Transformation
  • Data Analysis
  • Data Visualization
  • Project Submission
Our Advantage

Why Choose This Course

  • Beginner-Friendly, No Prerequisites
  • Live Interactive Online Classes
  • Recorded Videos for Reference
  • Suitable for both IT & Non-IT Students

Your Instructor

Parthiban Kannan

Parthiban Kannan

Co-founder & Manager

21 Courses

14+ years of experience in digital transformation, leading teams of 15+ members and delivering 160+ projects for organizations like Lakshmi Machine Works, Milacron, Schneider Electric, Aatomz Research, and Variablz Technologies. AI innovator with a patent approved by the Government of India, with strong expertise in Data Science, Data Analysis, Business Intelligence, and Software Development.

FAQ

Frequently Asked Questions

Do I need any prior programming or coding experience?

No. This course is designed for absolute beginners. We start from scratch, so even if you've never written a single line of code, you'll be able to follow along comfortably.

I'm from a Non-IT background. Can I still learn this?

Yes, absolutely. This course is specially designed for Non-IT professionals looking to switch into IT/Data roles. We focus on simple explanations and real-world practice rather than heavy technical jargon.

What if I miss a live class?

No worries u2014 every live session is recorded and shared with you, so you can watch it anytime at your own pace.

How long is this course?

This is a focused 4u20135 week bootcamp program, with live classes held in the evening from 6:00 PM to 7:00 PM.

Will I get a certificate after completing this course?

Yes, you will receive a course completion certificate that you can add to your resume and LinkedIn profile.

What tools will I learn in this course?

You'll learn Python, Pandas, NumPy, Matplotlib, and Seaborn u2014 the core tools used by Data Analysts in their daily work.

Does this course include dashboard creation (like Power BI/Tableau)?

No, this course focuses purely on Python-based data analysis and visualization. Dashboard tools are not covered in this program.

Is this course only theory, or will I work on real data?

This is a hands-on, practice-first course. You'll work on real, messy datasets and build a Capstone Project by the end u2014 just like an actual Data Analyst would.