
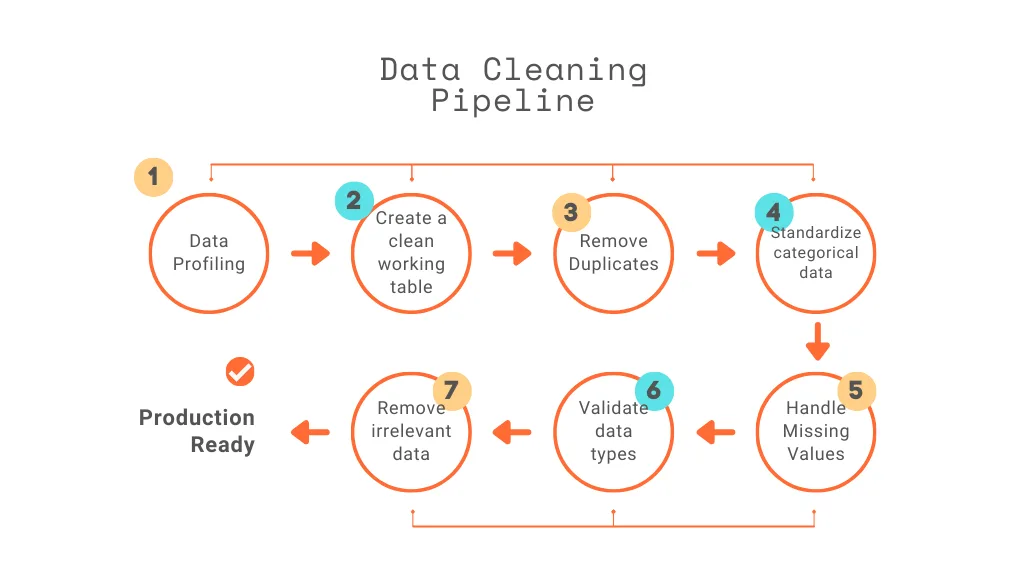
In this article, I will walk through the process of building a data cleaning pipeline in PostgreSQL for an HR Analytical project from a Business Analyst’s perspective, focusing not just on SQL steps, but on business value.
Data Cleaning Matters
As a Business Analyst, data is the foundation of every recommendation, dashboard, and strategic insight we deliver. However, raw datasets are rarely analysis-ready. They often contain missing values, duplicates, inconsistent formatting, and structural issues.
In HR Analytics, before conducting attrition analysis, workforce planning, or salary benchmarking, we must ensure the data is accurate and reliable.
From a business standpoint, poor data quality can:
- Distort attrition rates
- Misrepresent department performance
- Skew salary insights
- Lead to incorrect hiring decisions
E.g.: If duplicate employee records exist, workforce size may be overestimated. If salary values are missing, compensation analysis becomes unreliable.
Clean data ensures that insights presented to stakeholders are trustworthy and actionable. Let’s explore how to apply these steps one by one
Step 1: Data Profiling (Understanding Data Quality)
Let’s do the quick analysis of our data before start cleaning process. For every data job it’s our duty to find out how many records available before the cleaning process since after cleaning rows & columns we may have the clear summary of data quality improvement.
So using the following query, we can find how many records are there from raw data
Missing values from the data often cause math problems or may cause biased results on our analysis, so let’s identify the impact of missing values in our data set. It helps us decide what we are going to do with the missing values in the transformation step — whether we remove them or impute them with other values.
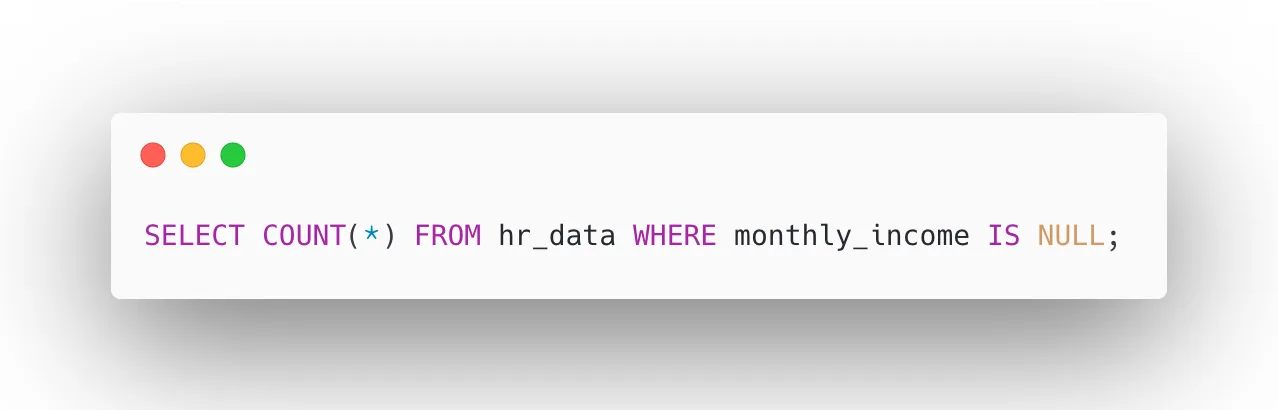
Here, I am finding the missing values from the monthly income column using this query.
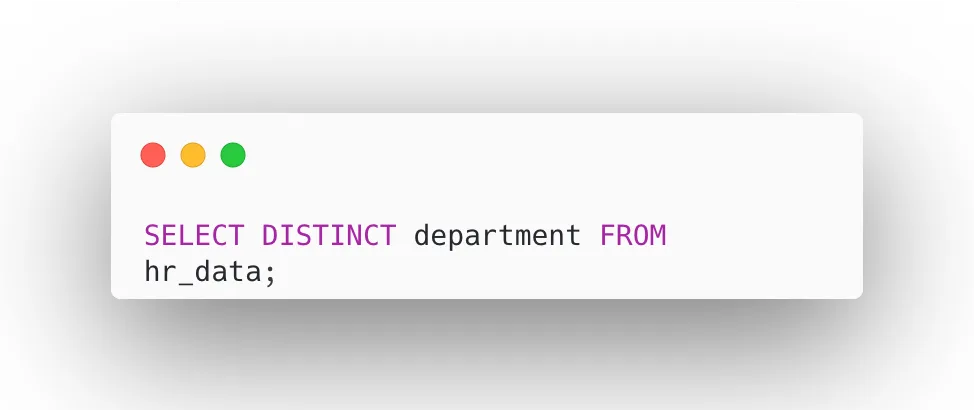
Analyzing the categorical columns for distinct values using this query helps us understand each categorical feature individually.
Data profiling reveals potential risks before analysis begins. Once we have done this, we can proceed to create a clean working table.
Step 2: Create a Clean Working Table
Rather than modifying the original raw data directly, let’s create a separate working table called hr_clean as a copy of hr_data. This approach preserves the integrity of our raw data, allowing us to revert or re-run the cleaning process at any time without data loss. All subsequent transformations, updates, and deletions will be applied exclusively to hr_clean, keeping the raw layer untouched and audit-ready.
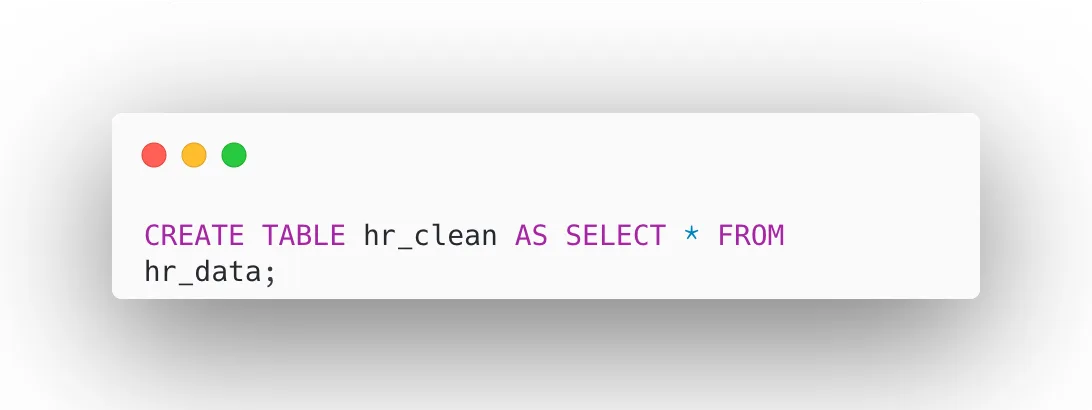
Now all transformations will occur in hr_clean.
Step 3: Remove Duplicates
Duplicate records in an HR dataset can significantly skew workforce metrics such as headcount, attrition rates, and salary totals. In this step, we identify and remove duplicate employee entries by retaining only the record with the minimum ctid (the physical row identifier in PostgreSQL) for each unique employeenumber. This ensures every employee appears exactly once in the clean dataset, giving us an accurate foundation for all downstream analysis and reporting.
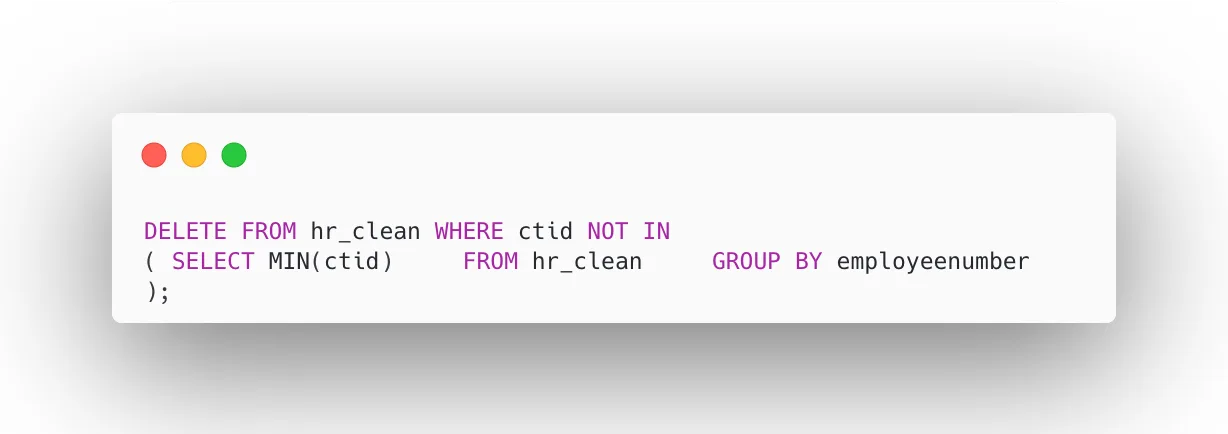
It ensures accurate headcount and reporting.
Step 4: Standardize Categorical Fields
Inconsistent text formatting in categorical columns like department and attrition can cause incorrect groupings during analysis. For example, “Sales” and “sales” would be treated as two different departments. In this step, we apply UPPER() to convert values to a consistent case and TRIM() to remove any leading or trailing spaces. This ensures that filters, GROUP BY operations, and pivot reports produce accurate and reliable results without duplicate or mismatched categories.
Here this ensures consistency in text data:
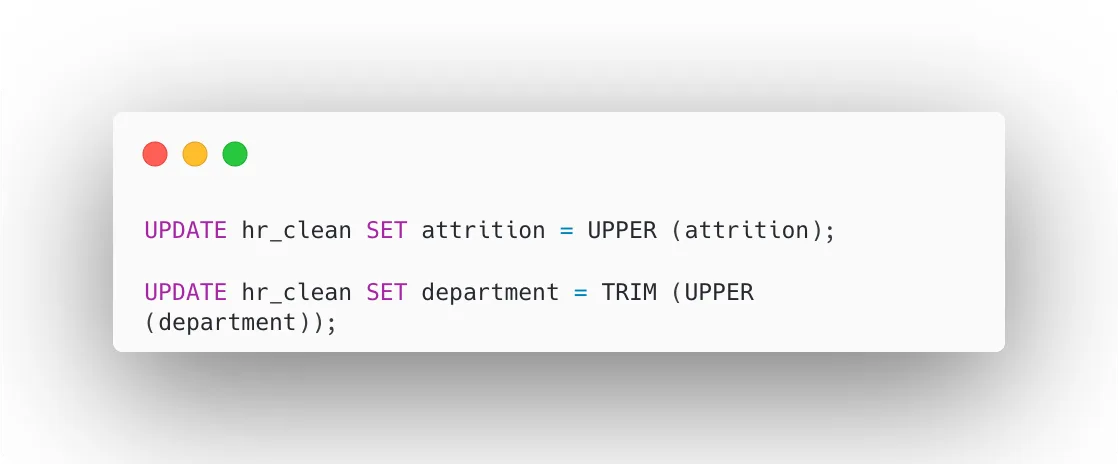
It prevents incorrect grouping during analysis.
Step 5: Handle Missing Values
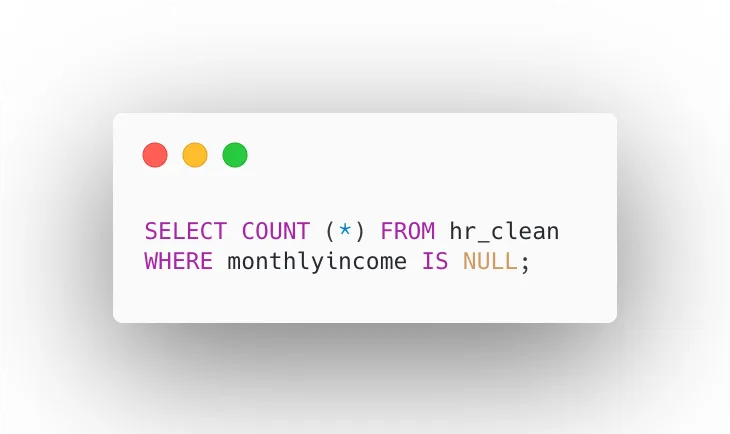
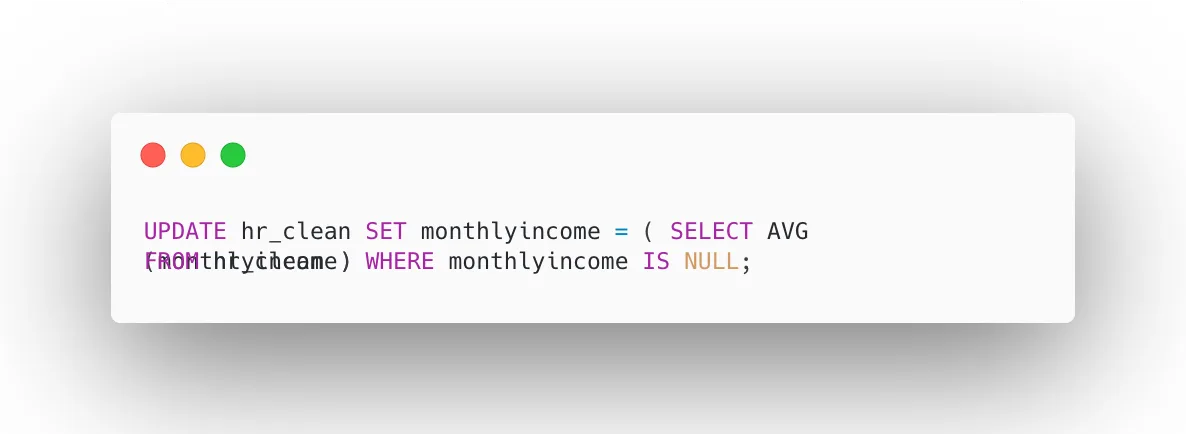
Missing values in key columns like monthlyincome can cause gaps in compensation analysis and lead to biased results if left unaddressed. In this step, we first identify records where monthlyincome is NULL, then replace those missing values with the average income calculated from the rest of the dataset.
This imputation method preserves the overall salary distribution, keeps all employee records intact, and ensures that workforce cost analysis and reporting remain statistically complete and business-ready.
Let’s check for NULL income values:
Replace with average income:
This imputation ensures salary analysis remains meaningful.
Step 6: Validate Data Types
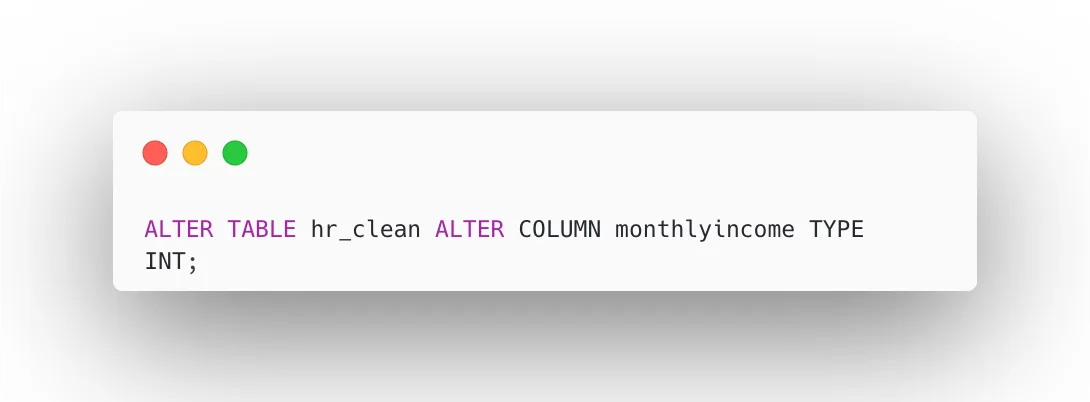
Data type validation ensures that every column is stored in its correct format before any analysis begins. If a salary column is stored as text instead of a numeric type, mathematical operations like averages and sums will fail or return incorrect results. In this step, we alter the monthlyincome column to an integer type, which improves query performance, ensures accurate aggregation, and maintains data reliability across all salary-related calculations and business reports.
Let’s verify that each column is stored in the correct format before performing analysis.
Ensure weather salary column is numeric:
Correct data types improve:
- Query performance
- Aggregation accuracy
- Data reliability
Step 7: Remove Irrelevant Columns
Not all columns in a raw dataset add analytical value. Columns like employee_count, which may contain constant or redundant values, add unnecessary noise to the dataset and can slow down queries and reports. In this step, we drop such irrelevant columns from hr_clean to streamline the table structure. A leaner dataset improves query efficiency, reduces storage overhead, and keeps dashboards and reports focused on meaningful business metrics.
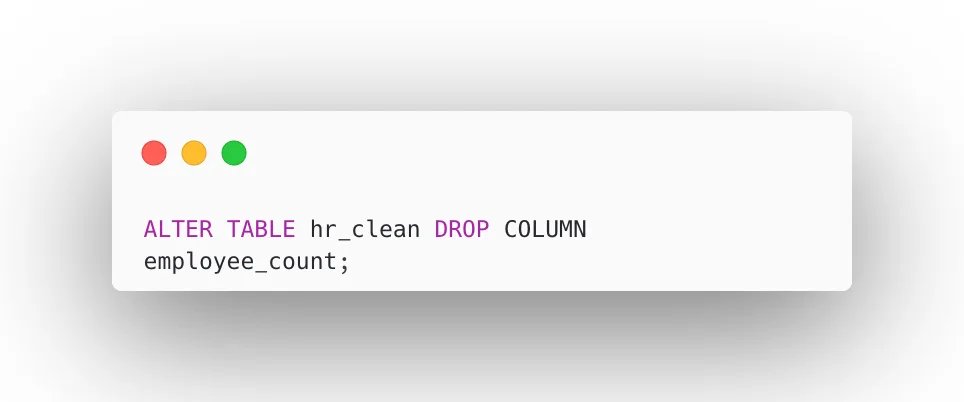
It keeps reporting focused and efficient.
Final Data Pipeline Architecture
CSV File ➡️ hr_data (Raw Layer) ➡️ hr_clean (Transformation Layer)
Here, we have built a data cleaning pipeline in PostgreSQL that transforms raw HR data into quality data, which can be further used to build analytical dashboards to improve business performance. Strong business decisions are only as good as the data behind them.
- Protect raw data — always preserve the original dataset before any transformation
- Standardize categorical values — consistency across categories ensures reliable analysis
- Remove duplicates before reporting — duplicate records distort metrics and mislead stakeholders
- Validate before deriving insights — never skip verification; assumptions lead to costly errors
I hope you found this useful as a base reference for your HR Analytics project. For more HR Analytics insights, follow me on LinkedIn — Oviya Sivanadiyan