

If you are using Power BI and creating visuals like pie charts you might face one common problem. When there are too many categories, the visual becomes crowded and difficult to understand. Especially in pie charts, too many slices make it very confusing.

Many people try to solve this using the Top N filter but this is not the correct way in many cases. Because Top N filter hides the remaining categories completely.
So, even though those categories have sales, they are not shown anywhere in the visual.
What you should do instead
Instead of hiding the remaining categories, you should group them into one category called “Others”.
This way:
- You can easily see the top categories
- Other categories are still included as “Others”
- Total sales value stays the same
Here follow my step by step approach to achieve this.
Step 1: Create a supporting table
First, create a new table:
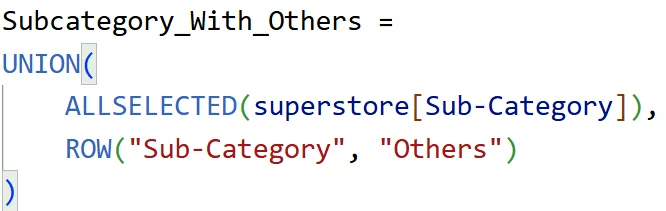
What this table does:
- It takes all Sub-Categories from your data.
- It adds one new value called “Others”.
Important Note:
- Do not create any relationship between this table and your main table.
- This table is only used to control what is shown in the visual, not to filter your data.
Step 2: Prepare all category sales
Next, create a measure and define this variable:
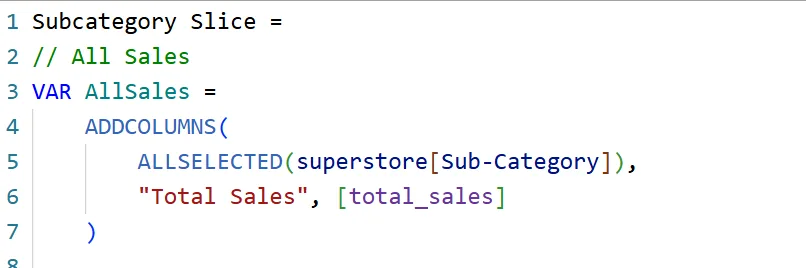
What this line does:
- It takes all Sub-Categories.
- It calculates the sales for each category.
- It stores both category name and sales together in one table.
So, now we have a table with Sub-Category and its Total Sales.
Step 3: Get current selected value
VAR CurrentSlice = SELECTEDVALUE(Subcategory_With_Others[Sub-Category])
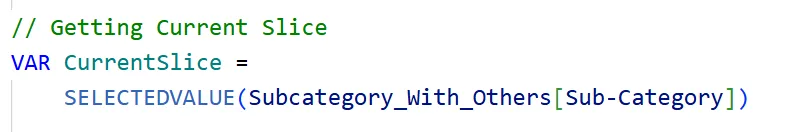
What this line does:
- It looks at the current row in the visual.
- It reads the category name shown in that row.
- That value can be a normal Sub-Category or “Others”.
- We use this value to decide what result to show.
Step 4: Get sales for current category
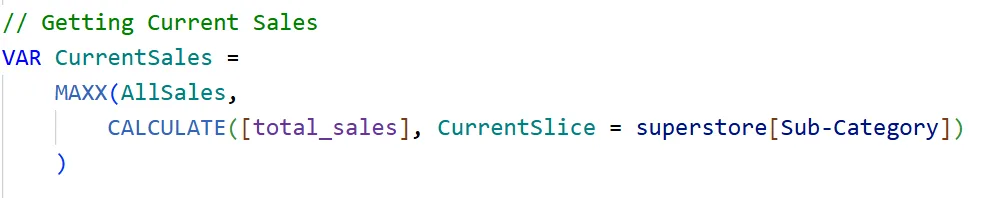
What this line does:
- It goes through each row in the AllSales table.
- It checks where the category matches the current selected value.
- It calculates the sales only for that matching category.
- Finally, it returns that sales value.
So, this step gives the exact sales for the current category.
Step 5: Get Top 3 categories
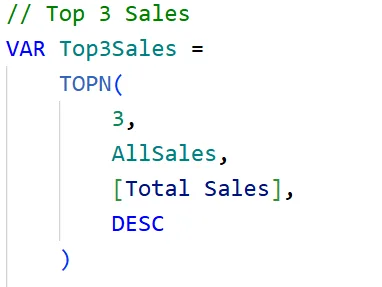
What this line does:
- It looks at all categories with their sales values.
- It sorts them from highest sales to lowest.
- It picks only the first 3 categories.
So, this step returns the top 3 categories based on sales.
Step 6: Calculate Others
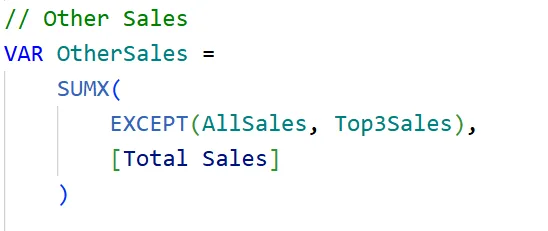
What this line does:
- It removes the Top 3 categories from the full list.
- It takes all the remaining categories.
- It adds their sales values together.
- It treats this total as one value called “Others”.
So, this step combines all remaining categories into a single “Others” value.
Step 7: Control what to display
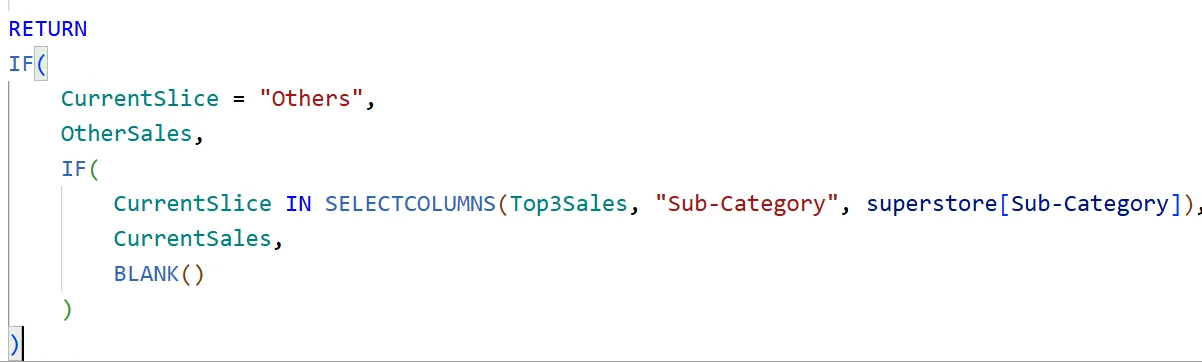
Final Output
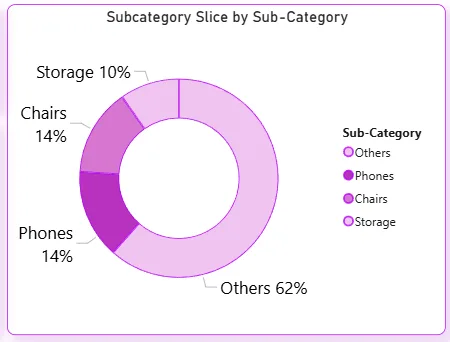
What happens in the visual:
- Only the Top 3 categories are displayed.
- All other categories are grouped together as “Others”.
- So instead of many small categories, you see fewer and clearer values.
- This makes the chart easier to read and understand quickly.
I hope this helped you clearly understand a better way to handle the Top N problem in Power BI.
Instead of simply hiding categories, this approach keeps all the data by grouping smaller categories into “Others”, which makes your visuals cleaner and more meaningful.
This method not only improves readability but also ensures your total values remain consistent.
If you feel anything is missing or if any part is still unclear, feel free to ask. I’ll be happy to explain it in an even simpler way!
Follow Jayasri Balakrishnan for more Business Intelligence Insights