

Project Work
 Jayasri Balakrishnan
View
Jayasri Balakrishnan
View
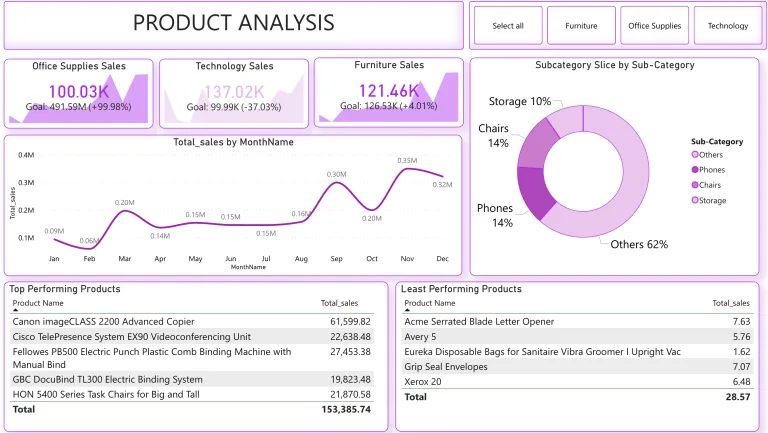
Superstore Sales Analytical Dashboard
Build my Sales Analytical Dashboard on Super Store Data Dashboard Link: https://app.powerbi.com/view?r=eyJrIjoiNDMzMzcxYjItYmUwNi00NzQ2LWFjNDctZmQwYzAzNTMyMDVjIiwidCI6IjBhMTY1MTY1LTI1YmMtNGMxZC04ZGM3LTU0MTBkODdjZDRmYSJ9&pageName=0e1c207ad51e5cc3aa74 2. Regionwise Analytical Report 3. Time Series Analysis
Jayasri Balakrishnan